Asana acquires StackAI — now every human-agent workflow runs in one place.Learn more
Concept map template: 4 types, examples & tips for work

Summary
When you start a project, it's crucial to make sure everyone on the team understands the same information. If team members are confused or misinformed, it can slow things down or even stop progress, costing time and money.
A great way to keep everyone aligned is by using a concept map. These diagrams help you see information clearly and make it easier for everyone to understand. In this article, you'll find out what concept maps are, learn about four main types, and see how templates can help you organize your ideas.
How to build a transformational AI strategy from the ground up
The journey of AI adoption is no longer uncharted territory. Supported by research from our Work Innovation Lab in partnership with frontier AI safety and research company, Anthropic, this guide offers a how-to for navigating the journey of AI adoption.
What is a concept map?
A concept map is a visual diagram that shows how ideas, processes, or systems are connected. It uses nodes for concepts and lines with labels to show relationships. You can use concept maps to outline workflow steps, show how an organization is structured, or map out how departments work together. They're popular in business, education, engineering, and science because they make complex topics easier to understand.
Key components of a concept map
Every concept map has key parts that work together to make the information clear. Knowing these parts will help you create better maps.
Component | Description |
Concepts | Main ideas or topics represented as words or phrases inside boxes or circles (nodes) |
Linking words | Words or phrases that connect concepts and show relationships (e.g., "leads to," "requires") |
Propositions | Meaningful statements created by combining two concepts with a linking word |
Focus question | The central question or problem your map is designed to answer |
Cross-links | Connections between concepts in different areas of your map |
When you include these parts, your concept map becomes more than just a diagram. It turns into a tool that shows relationships and makes complex topics easier to understand.
Benefits of using concept maps
If complex ideas feel overwhelming, concept maps can help you make sense of them. These visual tools organize your thoughts, make decisions easier, and help you find order in complicated situations. Here’s why they work so well:
A visual representation of key concepts and relationships helps you see the big picture.
Clear breakdowns of complex information lead to more productive brainstorming sessions.
The structure improves decision-making and stimulates problem-solving abilities.
Options such as spider maps, bubble maps, and Venn diagrams offer versatility.
Teams collaborate more effectively by using interactive maps for shared contributions.
Using free concept map templates saves time and helps you get started quickly.
When to use a concept map template
If you’re having trouble organizing your thoughts or planning a project, a concept map template can make things easier. Rather than starting from nothing, you can use a template to get going with a structure that’s already set up.
Consider using a concept mapping template in these situations:
You need to handle complex concepts or generate creative brainstorming ideas.
Your planning involves creating project management workflows or requires input from stakeholders.
You need a clear project planning method to track stages and workflows, such as a workflow diagram template.
You're preparing infographics, docs, or presentations and want an organized visual tool to display related concepts.
Find the best concept map template for you
Visualize workflows and simplify processes
4 types of concept map templates
There are many structures and formats for concept maps. The four most popular types are:
Spider maps, which are used to diagram concepts.
Flowcharts, which are used to visualize processes.
Hierarchy maps, which are used to visualize organizations.
System maps, which are used to visualize systems.
Type | Best for | Structure |
Spider map | Brainstorming, organizing ideas | Central concept with radiating branches |
Flowchart | Processes, workflows, decisions | Sequential steps with directional flow |
Hierarchy map | Organizations, classifications | Top-down levels from general to specific |
System map | Complex systems, interactions | Components inside/outside with process connections |
You can map almost any idea or process using one of these four types.
![[inline illustration] Common concept map types (infographic)](https://assets.asana.biz/transform/c9e443ea-326d-4a08-b14d-3ec789107920/inline-business-strategy-concept-map-template-1-2x?io=transform:fill,width:2560&format=webp)
1. Spider maps
A spider map starts with a key concept in the center and branches out into related ideas. Also called mind maps or idea webs, they're useful for guiding brainstorming sessions and organizing thoughts at a glance.
How to use a spider map
To make a spider map, draw a circle in the middle of your paper or whiteboard and write your main idea inside. Draw lines out from the circle and label them with related ideas. Keep adding more ideas and sub-ideas until you have a full web.
Free basic spider mapWhen to use a spider map
People usually make spider maps by hand during brainstorming, using scrap paper or a whiteboard. They don’t need to look perfect, but you can use the template above to help you start with some basic ideas.
2. Flowcharts
A flowchart is a diagram that shows the steps in a process. You can use flowcharts for anything from simple tasks, like filling out a purchase order, to more complex systems, like financial accounting.
Flowcharts are often used in business and engineering, but they can be helpful in any situation where you need to visualize a step-by-step process. The key to making an effective flowchart is to use universally recognized flowchart shapes that indicate what each step in your workflow means. The most common of these symbols are:
Ovals for terminators (starting point and end point)
Rectangles for processes
Diamonds for decisions
Parallelograms for inputs and outputs
Flowlines that connect shapes and indicate the order and direction of the workflow
There are also standard symbols for documents, manual input, preparation steps, data storage, loops, and delays. Using these familiar shapes means anyone can understand your flowchart, even if you’re not there to explain it.
Since flowcharts can look very different depending on the process, paper templates aren’t always the best choice. It’s easier to use an online tool to make your flowchart than to manage it with workflow software.
3. Hierarchy maps
If you've ever seen your company's organizational chart or worked on a family tree, you're already familiar with hierarchy maps. These maps arrange concepts from most general to most specific. For example, a company's org chart places executives at the top and moves downward through levels of decreasing authority.
How to use a hierarchy concept map
Hierarchy maps are often used to organize people, but they can also break down information into smaller, manageable parts. For example, a hierarchy map for this article could have "concept maps" at the top, each type on the second level, and details on the third.
Free basic hierarchy mapHow big or small your hierarchy map is depends on how many levels you need. You can use the template above to make a three-level map, with your main topic at the top, subtopics in the middle, and details at the bottom. You can also use colors or symbols to show what’s most important.
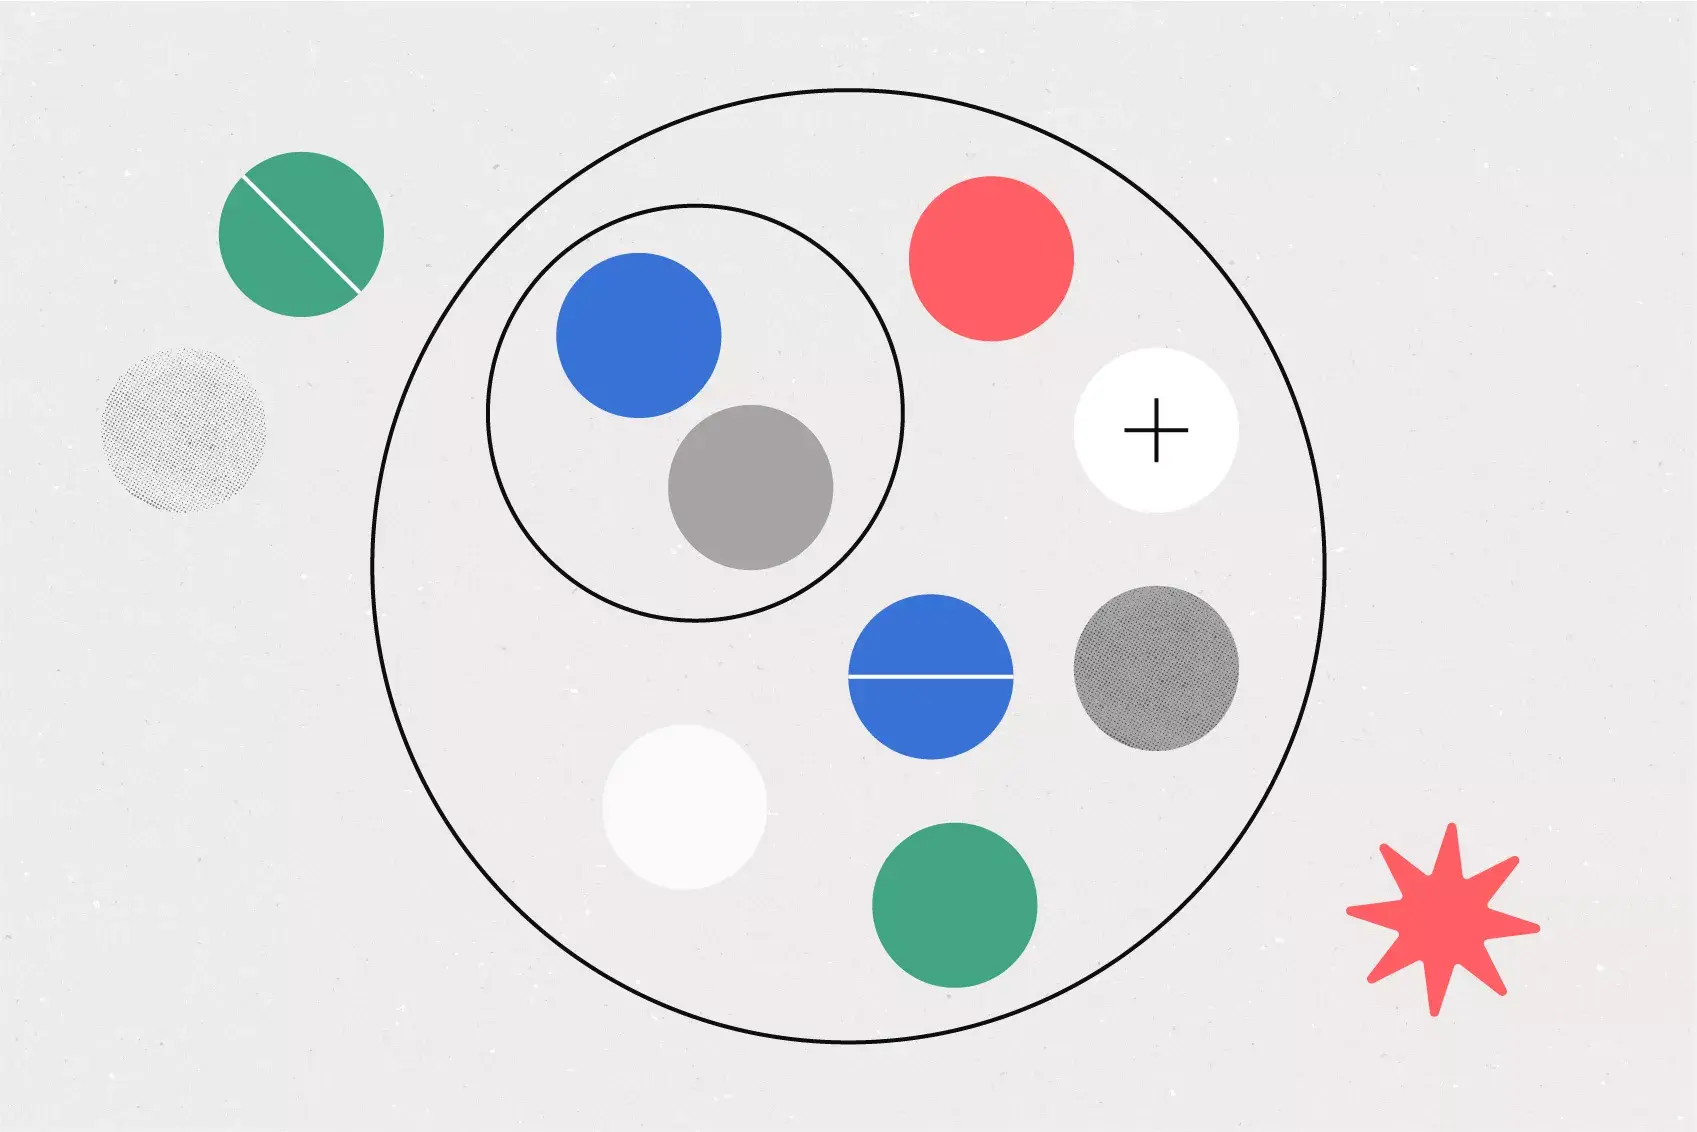
4. System maps
Spider maps organize ideas; flowcharts organize processes. System maps combine both to show organizational components and how they interact. Use them to illustrate simple systems, like a printer, or complex ones, like a multi-department company.
A system map has two main parts: everything inside the largest circle is the system, and everything outside is the environment. To make your map, put each part of the system inside the big circle and each part of the environment outside it.
Free basic system mapHow to use a system map
To create a system map for your company, start by adding circles for each department inside the main system circle. For example, accounting might include teams for payroll, budgets, and invoicing, while HR might cover onboarding, benefits, and crisis management.
You can include as many or as few elements as you need in each circle, depending on your organization’s structure. Outside the system circle, add items such as customers or third-party contractors. These interact with your company but aren’t part of the system itself.
Next, draw lines to show the processes that connect different parts. These lines can go between levels and link parts inside and outside the system. You can also show two-way connections between the same components.
System map example
For example, the payroll process flows bidirectionally between accounting and HR. HR onboards employees and sends salary information to accounting, which issues paychecks. Meanwhile, finance sends budget information for raises back to HR, which handles hiring and promotions.
Continue adding components and process connectors until you have a complete picture of the system. You can also use symbols to represent different types of interactions, like flows of information or resources.
Create a concept map today
Our free templates help you organize and collaborate
Concept map example
To see a concept map in action, imagine you’re planning a new product launch. You need to organize ideas, keep track of tasks, and manage your team’s workflow. A concept map helps illustrate each phase of the project.
In this concept map example, the central concept is "Product Launch." From there, you can break it down into primary branches, such as "Marketing Strategy," "Product Development," and "Launch Timeline." Each of these branches can be further divided into subtopics:
Marketing strategy: Includes tasks like setting up social media campaigns, defining target audiences, and creating promotional materials.
Product development: Focuses on finalizing the product features, conducting tests, and coordinating with suppliers.
Launch timeline: Outlines the key milestones, such as the beta release, soft launch, and full public launch.
When you connect these main ideas with arrows or lines, your team can see how each phase fits together. For example, the "Marketing Strategy" needs to match the "Launch Timeline" so campaigns are ready when the product is released.
How to use a concept map template
Using a concept map tA concept map template makes it easy to organize your thoughts, see complex ideas clearly, and turn brainstorming into real steps. Here’s a step-by-step guide to organizing a project management workflow.ight template
Pick a concept map template that matches your needs. For project workflows, use a template designed for outlining processes, such as a workflow diagram. This helps you map out tasks, responsibilities, and milestones all in one place.
Example: For a project involving multiple team members, a workflow diagram template helps you visualize the flow of tasks between departments, ensuring every stage is clear.
Step 2: Define your main concept
After you pick your template, find the main idea or central concept. This is the heart of your map, and everything else will branch out from here. In a project management example, the main idea might be "Project Workflow."
Example: In the center of your map, label the main node "Project Workflow." From here, you can branch out to the project's different phases, such as "Planning," "Execution," and "Completion."
Step 3: Add key concepts and subtopics
Next, add the main branches that stem from your central idea. These branches are the key concepts or stages. Then, break each one down into smaller topics or tasks.
Example: Under "Planning," you might create subtopics like "Define Goals," "Assign Roles," and "Set Deadlines." Each subtopic should clearly define actionable steps and serve as a focus for your ideation process.
Step 4: Connect related concepts
Once you have your main ideas and subtopics, connect them with lines or arrows. This shows how tasks or information move from one stage to the next.
Example: you can connect "Assign Roles" in the Planning phase to "Execution" to show how team roles impact the next step. This makes it clear how each part of the workflow affects what comes next, helping your project run smoothly.
Step 5: Review and refine
Finally, look over your concept map to make sure everything makes sense and all key ideas are included. This is a good time to add details or rearrange steps to make things clearer.
Example: After reviewing, you may realize you need to add a branch under "Execution" for "Monitor Progress." Refining your map ensures that the project workflow is thorough and ready for use.
By following these steps, you can use any concept map template to organize ideas, make complex information easier to understand, and help with decision-making.
Concept mapping basics
Begin by finding your focus question: the main idea or problem you want to solve. Then, break it down into smaller, related ideas and connect them with lines or arrows.
Here are some tips for effective concept mapping:
Keep your map organized by grouping similar ideas together and making sure the connections are easy to follow.
Choose tools that work for you. Software with features like collaboration, easy editing, integrations, and real-time updates can make the process smoother.
Be flexible be ready to adjust your map as new ideas or connections come up.
Start simple. If you’re new to concept mapping, use a basic structure at first and add more details as you get used to it.
Take your concept maps to the next level
Good planning helps every project run more smoothly. Using a concept map at the start lets you spot problems and bottlenecks early. Combine your concept map with a project management tool to stay organized and keep your team working toward the same goal.
Ready to put your concept maps into action? Get started with Asana today and turn your visual plans into organized, trackable projects that drive real progress for your team.
Find the best concept map template for you
Visualize workflows and simplify processes